Measuring ROI: How to Track the Success of Your Corporate Digital Signage
Digital signage delivers value when measurement guides every decision. Define success, track performance, and adjust fast. Use the structure below to prove results and improve outcomes.
Define success and align with business goals
Clear goals drive relevant content and smart placement.
Set measurable objectives
Pick outcomes you will track. Examples include higher town hall attendance, faster awareness for safety notices, or more traffic to intranet pages. Tie each screen to one primary objective. Write the target and a due date.
Map screens to outcomes
Assign each location a role. Lobby screens drive awareness. Operations screens support safety and throughput. Meeting zone screens promote events and training. One screen, one job.
Assign ownership and cadence
Name an owner for content, data, and review. Set a monthly or quarterly cycle. Owners publish goals, report results, and request changes.
Track reach and attention
Reach shows who saw the message. Attention shows time spent.
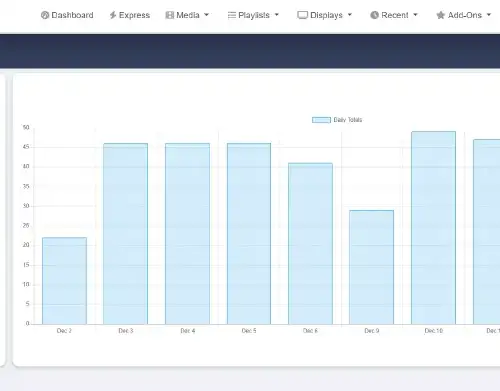
Screen uptime and play counts
Monitor device health, uptime, and playlist play counts. Zero downtime protects trust. Stable loops ensure fair exposure for every message.
Impressions and dwell time
Estimate impressions from foot traffic and schedule data. Use privacy-safe sensors or venue counters where available. Track dwell time near screens to confirm message exposure.
Message completion and readability
Aim for full message exposure during typical dwell. Keep slide length short enough for a single glance. Validate legibility from real viewing distances before rollout.
Track engagement and action
Engagement proves message relevance. Action proves value.
QR scans and short URL visits
Place a unique QR code or short URL on each slide. Tag links with UTM parameters. Count scans and visits per screen and per time block.
Attendance and sign-ups
Compare event attendance before and after signage promotion. Track sign-ups from QR and short links. Share lift as a percentage and as raw numbers.
Training completions and policy acknowledgments
Show progress to completion for required training. Track completions, time to completion, and late rates by site and shift.
Track business impact
Business impact closes the loop from views to outcomes.
Safety incident rate and time to alert
Measure incident rate over time by site. Track time from alert publish to staff acknowledgment. Look for faster acknowledgment and lower incident rate after campaigns.
Production throughput and downtime communication
Compare throughput, rework, or downtime minutes before and after signage updates near lines. Measure response time for outage notices. Report improvements alongside content changes.
HR outcomes linked to communication
Track onboarding task completion, benefits enrollment accuracy, and referral program participation. Attribute uplift to signage when QR or short links drive the action.
Calculate cost efficiency
ROI needs cost clarity and a fair comparison.
Total cost of ownership
List all costs. Hardware, mounts, players, licenses, installation, content production, support, and power. Annualize costs for a clean view.
Cost per impression and cost per action
Divide annual cost by impressions for CPI. Divide by tracked actions for CPA. Compare to email, intranet, and printed posters. Highlight lower CPI or stronger CPA where signage leads.
Time saved vs email and intranet publishing
Measure time from message request to employee view. Signage often reaches staff faster, especially frontline teams. Share hours saved per month.
Test and optimize
Small experiments drive steady gains.
A/B tests on headlines and loop order
Run two versions with different headlines or visuals. Keep only one variable per test. Compare scans, visits, or attendance. Promote winners network-wide.
Dayparting and location comparisons
Schedule content by shift and time of day. Compare results by slot. Move high performers to prime time. Retire weak performers.
Content decay and expiry rules
Track performance over time. Many slides decay after one to two weeks. Set expiry dates. Rotate fresh versions to maintain attention.
Data governance and privacy
Trust grows when teams respect privacy and access.
Consent and signage data policy
Publish a clear policy for sensors, analytics, and data retention. Use aggregated metrics for impressions and dwell.
Access control and audit
Limit edit and publish rights to trained staff. Review changes and approvals on a set cadence. Keep logs for audits.
Accessibility standards
Follow WCAG color contrast guidance. Use large type, plain backgrounds, and captions on every video. Accessibility supports reach and comprehension.
Reporting and stakeholder alignment
Consistent reporting secures buy-in and budget.
Monthly scorecard
Share goals, actuals, and trends. Include reach, engagement, actions, and business impact. Flag screens or sites that need attention.
Executive summary and next actions
Open with wins, risks, and three actions for the next period. Keep the summary on one page. Link to the detailed dashboard.
Roadmap for improvements
Plan content upgrades, placement changes, and device refresh cycles. Tie each improvement to a metric and a target date.